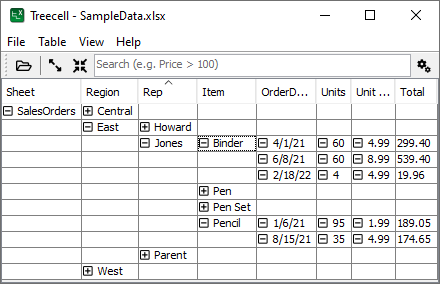
Treecell helps you visualize data from Excel files
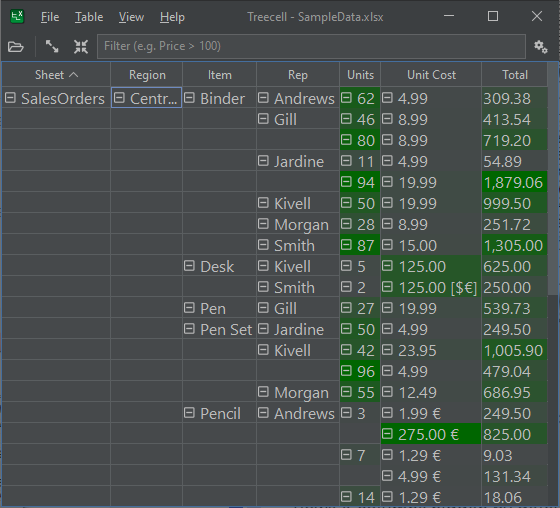
Heat Map
Version 1.2 adds heat map:
- Color gradient of the background of the cell based on the value of the number
- From dark red (low) to dark green (high)
- Based on zero, minimum, mean or medium
- Based on other values in the same column or in numbers in all columns
Graph
Version 1.2 adds multiple graph possibilities
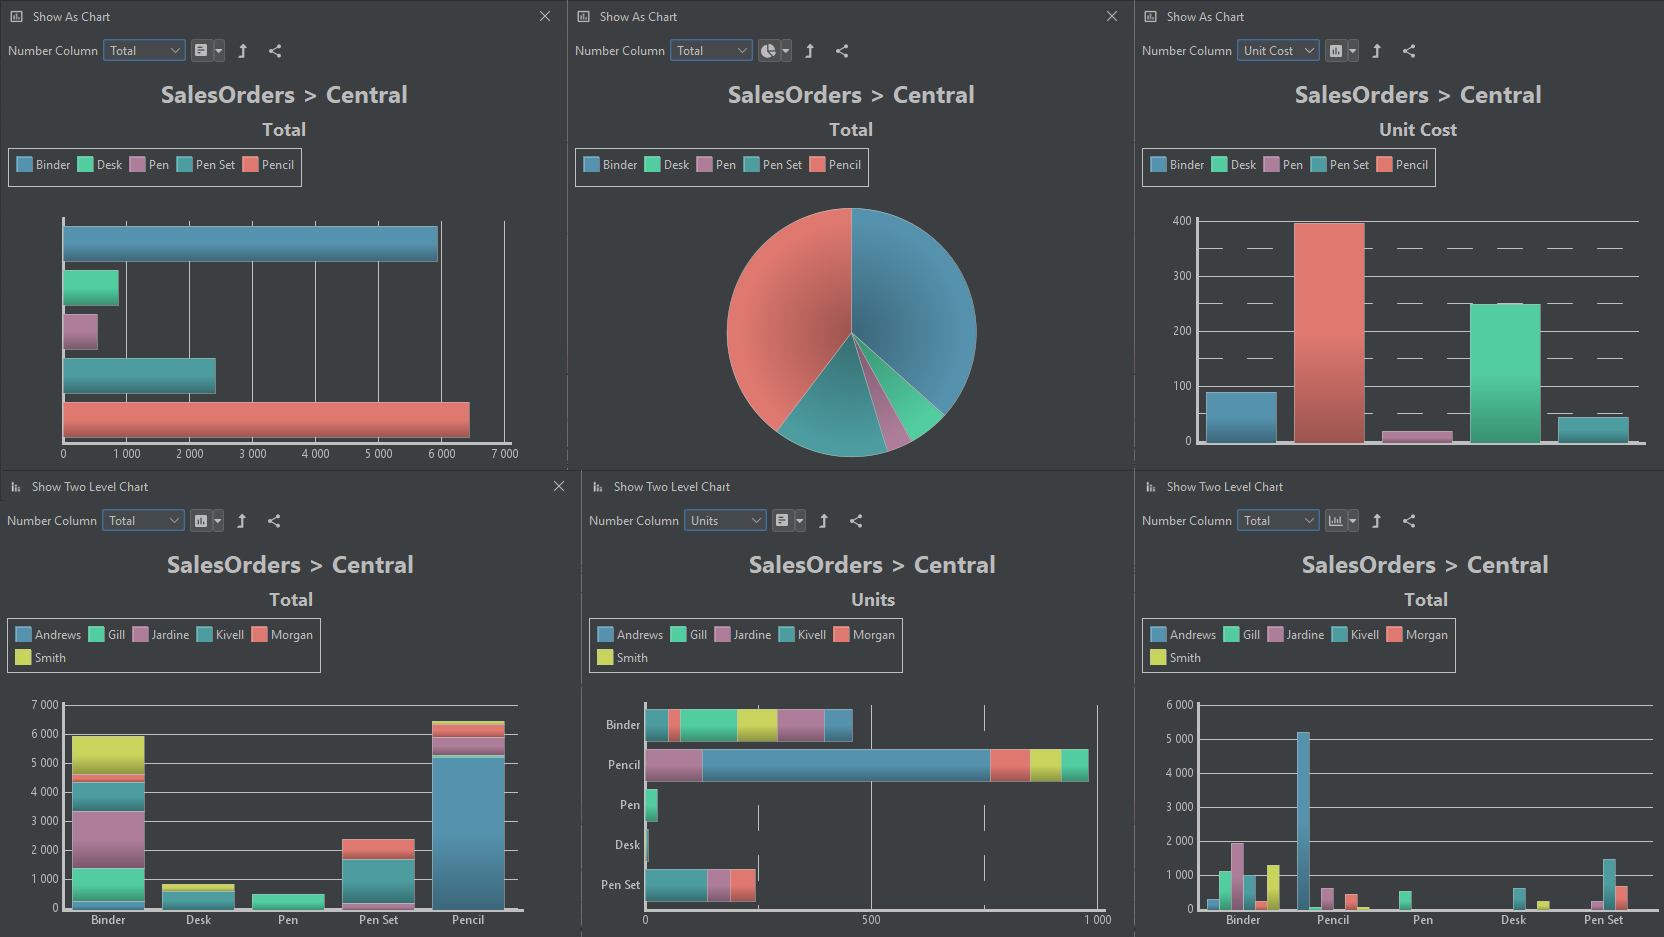
Show graph of a column value
- Vertical bars
- Horizontal bars
- Disc
- Navigate sub sections by click on the chart color (and up)
- Switch column with dropdown
- Take a screenshot of graph
- Based on selected section or section + sub-sections
And more
- Breadcrumbs and navigate table in ‘Next Column Stats’
- Drop Excel files in the interface to open them
- More than 50 changes in the application framework
Download for free and more info at Treecell | View Excel files as tree view (japplis.com)